
Setup kgdboc for kernel debugging
- Introduction
- Setup the VirtualBox VM
- Option 1: Debug via Host
- Option 2: Debug via another VM
- Gotchas
- Extras
The goal is to setup a Linux based VirtualBox VM which can be debugged from the host, or another VM. To debug using another physical machine, see Debug from another (physical) machine section.
Introduction
kgdboc is the debugger that helps debug the kernel over a remote gdb session.
kdb gives a debug console to run commands directly against the kernel. It can dump physical memory, list running processes etc.
At runtime one can dynamically switch between both the debugger. The latest official kernel doc is here.
Setup the VirtualBox VM
We will be debugging the VM’s kernel. Before we can debug the VM’s kernel, we need to prep the VM.
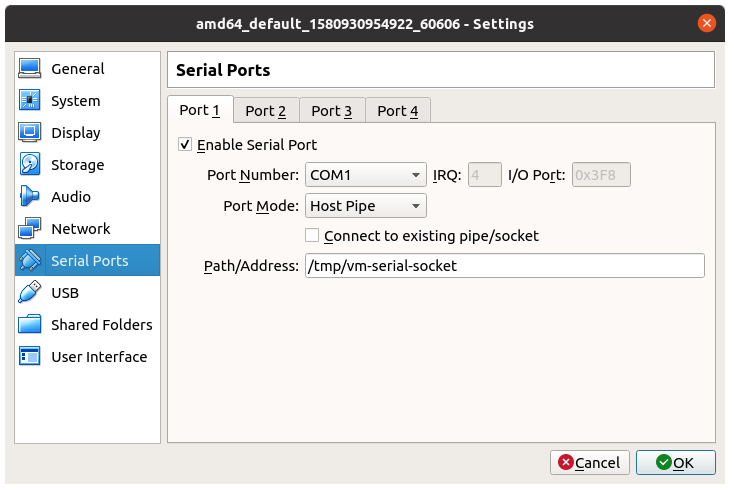
To begin, go to the VM’s settings and open “Serial Ports”. Enable COM1, select port mode to be “Host Pipe”. Give the path as “/tmp/vm-serial-socket”. Make sure to have “Connect to existing pipe/socket” unchecked.
Alternatively if you are using vagrant, then add the following to your Vagrantfile and then run vagrant reload.
1
2
3
4
5

config.vm.provider "virtualbox" do |vb|
  vb.customize ["modifyvm", :id,
    "--uart1", "0x3f8", "4",
    "--uartmode1", "server", "  /tmp/vm-serial-socket"]
end
Now we need to make sure that the kernel is compiled with debugging support. In kernel config, look under “Kernel hacking” ‣ “Kernel debugging” and select KGDB: kernel debugger.
To be able to add software breakpoints to the running kernel, we need to disable kernel’s read-only data protection. In kernel config, look under “Kernel hacking” ‣ “Write protect kernel read-only data structures” and unselect this option.
The above will modify the .config file as below -
1
2
3
4
5
6
7
8
9
10

# These options need to enabled in .config
CONFIG_FRAME_POINTER=y
CONFIG_KGDB=y
CONFIG_KGDB_SERIAL_CONSOLE=y

# To disable RO protection on older kernels (ex. v3.2)
CONFIG_DEBUG_RODATA=n

# To disable RO protection on newer kernels (ex. v5.6.0)
CONFIG_STRICT_KERNEL_RWX=n
Recompile and install the newly compiled kernel.
Now to enable debugging support during boot, we need to add kgdboc=ttyS0,115200 to the kernel’s command line options. Also to do meaningful debugging, we disable KASLR using nokaslr. For Ubuntu based distro, this can be done via the /etc/default/grub file.
1
2
3
4
5
6
7
8
9
10
11
12

vm1$ echo 'GRUB_CMDLINE_LINUX_DEFAULT="console=tty0 nokaslr kgdboc=kbd,ttyS0,115200"' | sudo tee -a /etc/default/grub

vm1$ sudo update-grub
Generating grub.cfg ...
Found linux image: /boot/vmlinuz-3.2.0-pfwall-fedora-patches+
Found initrd image: /boot/initrd.img-3.2.0-pfwall-fedora-patches+
Found linux image: /boot/vmlinuz-3.2.0-126-virtual
Found initrd image: /boot/initrd.img-3.2.0-126-virtual
Found memtest86+ image: /boot/memtest86+.bin
done

vm1$ sudo reboot
After rebooting the virtual machine, verify that the serial port configured -
1
2
3
4
5
6
7
8
9
10
11
12

# Verify serial port
vm1$ dmesg | grep serial
[    2.149591] serial8250: ttyS0 at I/O 0x3f8 (irq = 4) is a 16550A

# Verify kernel debugging support
vm1$ dmesg | grep kgdboc
[    0.000000] Command line: BOOT_IMAGE=/boot/vmlinuz-3.2.0-pfwall-fedora-patches+ root=UUID=7d69eb56-ea8c-4243-8e7d-e2714fced818 ro console=tty0 kgdboc=kbd,ttyS0,115200
[    0.000000] Kernel command line: BOOT_IMAGE=/boot/vmlinuz-3.2.0-pfwall-fedora-patches+ root=UUID=7d69eb56-ea8c-4243-8e7d-e2714fced818 ro console=tty0 kgdboc=kbd,ttyS0,115200
[    3.458898] kgdb: Registered I/O driver kgdboc.

# To dynamically change the kgdboc parameters, use -
vm1$ echo ttyS0,115200 | sudo tee /sys/module/kgdboc/parameters/kgdboc
To manually trigger a kernel trap and enter into the debug prompt, use the following command. Note that the ssh session or VM’s console will hang after running the below command.
1
2

# Trigger a trap
vm1$ echo g | sudo tee /proc/sysrq-trigger
Option 1: Debug via Host
/tmp/vm-serial-socket gets created by VirtualBox when the VM is started.
1
2

host$ file -i /tmp/vm-serial-socket
/tmp/vm-serial-socket: inode/socket; charset=binary
To enable gdb to access the socket, we need to expose a pseudoterminal device. For this we use socat.
1
2
3
4

host$ socat /tmp/vm-serial-socket PTY,link=/tmp/vm-serial-pty &

# For debugging
host$ socat -d -d -d -d /tmp/vm-serial-socket PTY,link=/tmp/vm-serial-pty
Looking at the pty file that socat creates -
1
2
3
4
5

host$ file /tmp/vm-serial-pty
/tmp/vm-serial-pty: symbolic link to /dev/pts/8

host$ file /dev/pts/8
/dev/pts/8: character special (136/8)
Using gdbserver
Run the below commands after trigerring a kernel trap in the VM (via sysrq), otherwise gdb will timeout with the error.
1
2
3
4
5
6
7
8
9
10
11
12
13
14
15
16
17
18
19
20
21
22
23
24
25
26
27
28
29

host$ gdb kernel/vmlinux -ex "target remote /tmp/vm-serial-pty"
GNU gdb (Ubuntu 8.1-0ubuntu3.2) 8.1.0.20180409-git
Copyright (C) 2018 Free Software Foundation, Inc.
...
Reading symbols from kernel/vmlinux...
done.
Remote debugging using /tmp/vm-serial-pty
kgdb_breakpoint () at kernel/debug/debug_core.c:960
960     kernel/debug/debug_core.c: No such file or directory.
(gdb)
(gdb) bt
#0  kgdb_breakpoint () at kernel/debug/debug_core.c:960
#1  0xffffffff810bbef0 in sysrq_handle_dbg (key=<optimized out>) at kernel/debug/debug_core.c:750
#2  0xffffffff81386181 in __handle_sysrq (key=103, check_mask=false) at drivers/tty/sysrq.c:522
#3  0xffffffff8138627b in write_sysrq_trigger (file=<optimized out>, buf=<optimized out>, count=2, ppos=<optimized out>) at drivers/tty/sysrq.c:870
#4  0xffffffff811b20c1 in proc_reg_write (file=0xffff88026ca7db00, buf=0x7fffffffc650 "g\n", count=2, ppos=0xffff88026c503f48) at fs/proc/inode.c:218
#5  0xffffffff811596a5 in vfs_write (file=0xffff88026ca7db00, buf=0x7fffffffc650 "g\n", count=2, pos=0xffff88026c503f48) at fs/read_write.c:438
#6  0xffffffff811599bb in sys_write (fd=<optimized out>, buf=0x7fffffffc650 "g\n", count=2) at fs/read_write.c:495
#7  <signal handler called>
#8  0x00007ffff7b01f10 in ?? ()
#9  0x0000000000000000 in ?? ()
(gdb) continue

# To reboot (refer kernel/debug/gdbstub.c:gdb_cmd_reboot())
maintenance packet R0

# To switch to the kdb shell
maintenance packet 3
# and exit gdb with CTRL-C
The following is the timeout error if the kernel being debugged does not trap before gdb tries to connect. If this happens, then quit gdb, run echo g | sudo tee /proc/sysrq-trigger in the vm (kernel being debugged) and then run the above gdb command.
1
2
3
4
5
6
7
8
9
10
11
12
13
14

# Error on timeout
host$ gdb kernel/vmlinux -ex "target remote /tmp/vm-serial-pty"
GNU gdb (Ubuntu 8.1-0ubuntu3.2) 8.1.0.20180409-git
Copyright (C) 2018 Free Software Foundation, Inc.
...
Remote debugging using /tmp/vm-serial-pty
Ignoring packet error, continuing...
warning: unrecognized item "timeout" in "qSupported" response
Ignoring packet error, continuing...
Remote replied unexpectedly to 'vMustReplyEmpty': timeout
(gdb)

# Optionally, to view gdb's protocol packets
host$ gdb kernel/vmlinux -ex "set debug remote 1" -ex "target remote /tmp/vm-serial-pty"
Using kbd
After issuing maintenance packet 3 in gdb shell, you would have switched to the kbd shell. Now you can connect to the serial port (pty) directly using screen.
Again note that you can see a blank screen (after invoking screen) unless you issue a kernel trap in the kernel being debugged. If this happens then run echo g | sudo tee /proc/sysrq-trigger in the vm (kernel being debugged).
1
2
3
4
5
6
7
8
9
10
11
12
13
14
15
16
17
18
19
20
21
22
23
24
25
26
27
28
29
30
31
32
33
34
35

host$ screen /tmp/vm-serial-pty
[1]kdb> ps
3 idle processes (state I) and
51 sleeping system daemon (state M) processes suppressed,
use 'ps A' to see all.
Task Addr               Pid   Parent [*] cpu State Thread             Command
0xffff88026c51dc70     2033     2032  1    1   R  0xffff88026c51e0e0 *tee

0xffff88028e4c0000        1        0  0    1   S  0xffff88028e4c0470  init
0xffff88026d7bdc70      280        1  0    2   S  0xffff88026d7be0e0  python
0xffff88026d7fdc70      367        1  0    1   S  0xffff88026d7fe0e0  upstart-udev-br
0xffff88026efb5c70      369        1  0    1   S  0xffff88026efb60e0  udevd
...

# For help
[1]kdb> ?
Command         Usage                Description
----------------------------------------------------------
md              <vaddr>              Display Memory Contents, also mdWcN, e.g. md8c1
mdr             <vaddr> <bytes>      Display Raw Memory
mdp             <paddr> <bytes>      Display Physical Memory
mds             <vaddr>              Display Memory Symbolically
mm              <vaddr> <contents>   Modify Memory Contents
go              [<vaddr>]            Continue Execution
...

# To continue kernel execution
[1]kdb> go

# To revert to kgdboc
[1]kdb> kgdboc
Entering please attach debugger or use $D#44+ or $3#33

# Use Ctrl-A + k to kill the screen session.
# Connect over kgdboc using gdb.
Option 2: Debug via another VM
We can also spawn another virtual machine (say VM2) and debug the the first virtual machine (VM1).
For this we need to set up VM2 to be the client for the socket created by VM1. Go to the VM2’s settings and open “Serial Ports”. Enable COM1, select port mode to be “Host Pipe”. Give the path as “/tmp/vm-serial-socket”. Check the option “Connect to existing pipe/socket”.

Alternatively if you are using vagrant, then add the following to your Vagrantfile and then run vagrant reload.
1
2
3
4
5

  config.vm.provider "virtualbox" do |vb|
    vb.customize ["modifyvm", :id,
      "--uart1", "0x3f8", "4",
      "--uartmode1", "client", "  /tmp/vm-serial-socket"]
  end
Now start VM2 and verify the serial connection using -
1
2
3

# Verify serial port
vm2$ dmesg | grep serial
[    2.149591] serial8250: ttyS0 at I/O 0x3f8 (irq = 4) is a 16550A
Now VM2 sees a physical serial port instead of a socket. Hence we no longer need to use socat to create a pseudoterminal device. The following is a summary of updated commands -
1
2
3
4
5

# Debug via kgdboc
vm2$ sudo gdb /vagrant/kernel/vmlinux -ex "target remote /dev/ttyS0"

# Debug via kdb
vm2$ sudo screen /dev/ttyS0
Gotchas
Remote debugging (i.e. press CTRL-C to drop into gdb prompt) cannot be triggered over serial or via gdb. You need to break in from the guest kernel (using sysrq).
Extras
Kernel’s command line parameters
1
2

vm1$ cat /proc/cmdline
BOOT_IMAGE=/boot/vmlinuz-3.2.0-pfwall-fedora-patches+ root=UUID=7d69eb56-ea8c-4243-8e7d-e2714fced818 ro console=tty0 nokaslr kgdboc=kbd,ttyS0,115200
Get kernel symbols at runtime
1
2
3
4
5
6
7

# Get runtime symbol table
vm1$ sudo head -5 /proc/kallsyms
0000000000000000 D irq_stack_union
0000000000000000 D __per_cpu_start
0000000000004000 D gdt_page
0000000000005000 d exception_stacks
000000000000b000 d tlb_vector_offset
Note that only superuser (i.e. root) can read the kernel addresses of the symbols.
1
2
3
4
5
6

vm1$ head -5 /proc/kallsyms
0000000000000000 D irq_stack_union
0000000000000000 D __per_cpu_start
0000000000000000 D gdt_page
0000000000000000 d exception_stacks
0000000000000000 d tlb_vector_offset
Print variables from the live kernel
The file /proc/kcore is the kernel’s core dump file at a specific time. gdb can be used to interpret it.
1
2
3
4
5
6
7
8
9
10
11
12
13
14
15
16
17
18
19
20
21

vm1$ gdb /vagrant/kernel/vmlinux /proc/kcore
GNU gdb (Ubuntu/Linaro 7.4-2012.04-0ubuntu2.1) 7.4-2012.04
Copyright (C) 2012 Free Software Foundation, Inc.
License GPLv3+: GNU GPL version 3 or later <http://gnu.org/licenses/gpl.html>
This is free software: you are free to change and redistribute it.
There is NO WARRANTY, to the extent permitted by law.  Type "show copying"
and "show warranty" for details.
This GDB was configured as "x86_64-linux-gnu".
For bug reporting instructions, please see:
<http://bugs.launchpad.net/gdb-linaro/>...
Reading symbols from /home/vagrant/linux-pfwall/vmlinux...done.
[New process 1]
Core was generated by `BOOT_IMAGE=/boot/vmlinuz-3.2.0-pfwall-fedora-patches+ root=UUID=7d69eb56-ea8c-42'.
#0  0x0000000000000000 in ?? ()

(gdb) p vfs_read
$4 = {ssize_t (struct file *, char *, size_t, loff_t *)} 0xffffffff811597a1 <vfs_read>

(gdb) print irq_err_count
$11 = {counter = 0}
Reloading the core dump -
1
2
3
4

(gdb) core-file /proc/kcore
[New process 1]
Core was generated by `BOOT_IMAGE=/boot/vmlinuz-3.2.0-pfwall-fedora-patches+ root=UUID=7d69eb56-ea8c-42'.
#0  0x0000000000000000 in ?? ()
View printk messages in gdb
This feature is available on newer kernels such as v5.6.0. Use any of the following methods to enable printks’ in the gdb console -
Method #1: Add kgdbcon to kernel’s command line option.
Method #2: At runtime, use sysfs before configuring an I/O driver (i.e. kgdb)
1

echo 1 | sudo tee /sys/module/kgdb/parameters/kgdb_use_con
Debug from another (physical) machine
When using a physical serial connection, i.e. debugging one physical machine (instead of a VM) using another physical machine, it may be necessary to specify the baud rate. Also root permissions are needed to access the serial port (hence the sudo).
gdbserver
1
2
3
4
5

host$ file /dev/ttyUSB0
/dev/ttyUSB0: character special (188/0)

# Debug via physical serial
host$ sudo gdb vmlinux -ex "target remote /dev/ttyUSB0" -b 115200
kbd
1
2
3
4

# -L records the entire session in screenlog.0
host$ sudo screen -L /dev/ttyUSB0 115200

# To exit use: Ctrl+a k y
Updates
- October 1, 2020:
- Guidelines to debug a physical machine
- Instructions to reboot kernel via gdb
- April 7, 2020:
- Add kernel config option to disable read-only kernel protection
- Method to view printk messages in gdb
- March 31, 2020:
- Add – Print variables from the live kernel
- Add – Kernel’s command line parameters
- Add – Get kernel symbols at runtime
← Back to homepage